Ghidra Code Analysis
by Coleman Kane
Table of Contents
- Introduction
- Load Them Into Ghidra
- Initial Comparison - Symbol Tree
- Discovering Entry Point
- Analysis of Disassembly
- Code Representation
- Continued In Next Post
Introduction
For learning how to use Ghidra to analyze and decipher code, I often find it helpful to analyze a compiled simple program for which I have the source code.
algo1.cpp
Below is the source code to a simple C++ program. The program manages a single stack data structure, accepts a list of strings, 1 per line, from the user, and then when the user is finished, the program will prompt the user for a string. It will scan through the stack for the presence of said string and if it matches (case sensitively) one of the strings the user just entered, then it will report a successful message. Otherwise, it will report failure to the user.
#include <iostream>
#include <string>

using namespace std;

struct Node {
    struct Node *next;
    string data;
};

struct Container {
    struct Node *head;

    Container(void) {
        head = nullptr;
    };

    ~Container(void) {
        while(head != nullptr) {
            pop();
        };
    };

    void push(string &data) {
        Node *newnode = new Node;
        newnode->data = data;
        newnode->next = head;
        head = newnode;
    };

    string pop(void) {
        Node *newnode = head;
        string data = head->data;
        head = head->next;
        delete newnode;
        return data;
    };

    bool contains(string &data) {
        Node *ptr = head;
        while(ptr != nullptr) {
            if(ptr->data == data) {
                return true;
            };
            ptr = ptr->next;
        };

        return false;
    };
};

Container cobj;

int
main(int argc, char **argv) {
    cout << "Enter strings one per line for list. Empty line to terminate:" << endl;

    string s;
    do {
        getline(cin, s);
        cobj.push(s);
    } while(s.size() > 0);

    cout << endl << "Now enter a string to find it in the list:" << endl;

    getline(cin, s);

    if(cobj.contains(s)) {
        cout << "Your string \"" << s << "\" was found!" << endl;
    } else {
        cout << "Your string \"" << s << "\" was NOT found!" << endl;
    }

    return 0;
}
Download: algo1.cpp
Quick Analysis of Source Code
The above code has the following attributes:
- A class to encapsulate data payloads: This is a common data-wrapping technique, and you’re likely to encounter it when dealing with networking code for backdoors and RATs.
- A class to contain multiple items: In this case, I decided to implement a very simplistic stack data structure that should be familiar enough of an interface for you to understand how it is used in the program.
- Arguments passed by reference & passed by pointer
- Dynamic memory management
- Pointer-based Iteration
Compiling
The above can be compiled using the following line (assuming you have llvm clang, otherwise c++ or g++ as needed):
clang++ -o algo1 algo1.cpp
Furthermore, for a dose of realism, make a copy of it and use strip to remove symbols and other debugging hints from
the compiled binary:
cp algo1 algo1_full
strip algo1
The second step will render the binary slightly harder to analyze, and also will make it about 25% smaller. This is a more representative example of the type of challenge you’ll face in the field.
I will also provide a copy of each for download here, just so that you may perform the analysis with minimal compiler variation:
Load Them Into Ghidra
Create a new Ghidra project, and import both files into it.
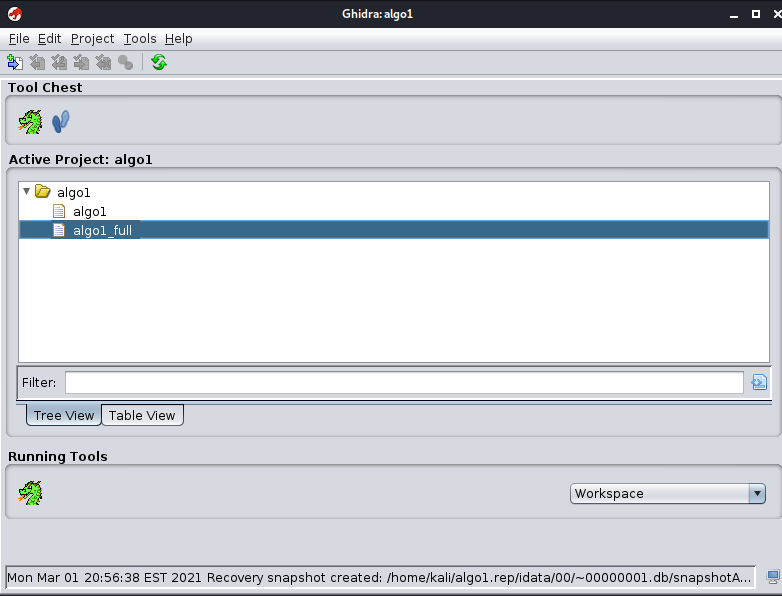
Once done, you may open both files (they’ll pop up in separate windows), and have Ghidra start analyzing them both.
Initial Comparison - Symbol Tree
Initially, the view looks pretty similar between both files. However, as you start to expand the contents of the symbol trees, you’ll see where the major differences are. For example, expanding the Classes branch:
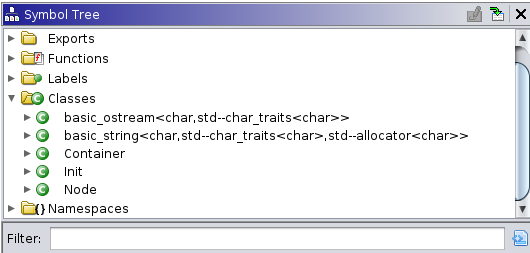
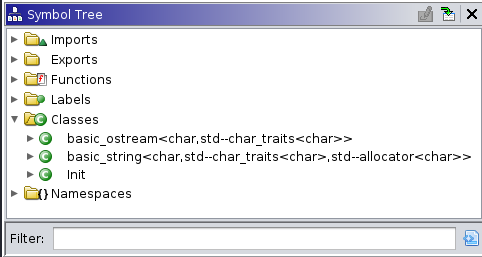
In the above examples, the first image is the algo1_full program, the copy of it that still contains all of the helpful
debugging symbols. The second one is from the version of the program after these symbols have been stripped. What has
happened here is that the strip program has gone through and removed any variable names, type identifiers, and other
human-readable data that was entirely local to this program. In this case, the two classes defined in the source code,
Node and Container were only defined for the scope of this program. The strip tool recognizes this, and removes
these - largely to help conserve space. The consequence of this is that Ghidra no longer will be able to easily present
these classes to you using their helpful names.
Function names
Similarly, the function names present are different.
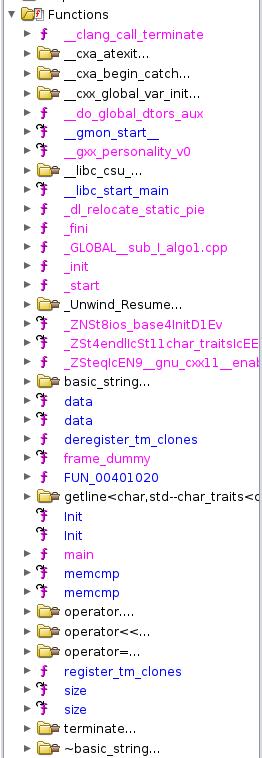

One thing notable about the above is that the stripped version of the program has a large group of functions with the
name FUN_########, where the ######## is a virtual memory address. Whenever Ghidra cannot connect a function to a
function name, it will auto-generate a name for that function that begins with FUN_ and add to it the virtual
memory address of the beginning of the function. Since only a single function may begin at any single address within a
program, this results in an automatic function naming scheme that is guaranteed to have no collisions. Thus, what you
are seeing here is a direct outcome of using the strip utility on the program: Ghidra has to make up its own names,
and as well has to try to “guess” the function arguments and return value types.
You’ll also notice, if you look a bit closer, that the version on the left also contains functions like _init,
_start, main. Both versions of them, however, appear to still maintain the symbols for the std::string and
various iostream operators and calls, such as getline. This latter observation is due to the fact that these
symbols are referenced in external shared libraries (libstdc++ to be precise). That said, looking around at the
code, it appears that the algo1_full seems to display less functions, than the stripped algo1, which would
seem counter-intuitive initially - as both should implement and reference the same number of functions.
In algo1_full, if you expand the Classes again, and then expand the Container and Node types, you
will reveal a number of additional functions.
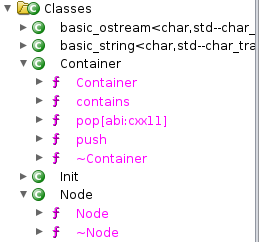
All of the class methods under both data types came up as bare
functions in the stripped algo1 sample, while in the unstripped algo1_full, Ghidra is appropriately connecting
them up with the data type that they operate on.
Discovering Entry Point
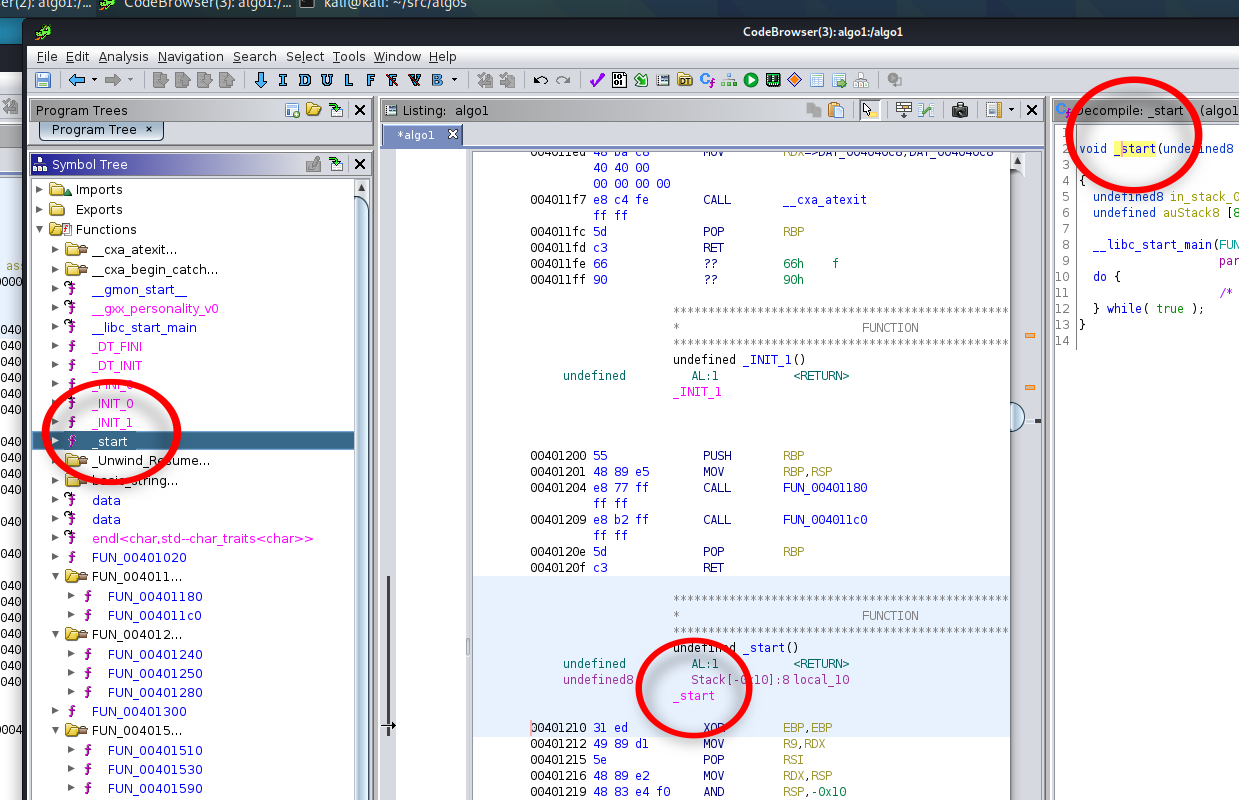
Finding the entry point is easy enough in both examples. For a typical program compiled with gcc or clang, the entry
point is typically given the name _start. In the stripped case, Ghidra automatically assigns this the name entry
as the default function name. A quick adjustment to make these consistent could be to rename this function with the
proper name _start, in the algo1 program. So go ahead and right-click on the function name entry in the Symbol
Tree, and then change its name to _start. You’ll notice that the function name entry has also been renamed in every
other view it is used in. Ghidra maintains a symbol database, and whenever symbol edits are made anywhere within the code,
corresponding fixes are made to the disassembled and decompiled program elsewhere, to reconcile it.
Analysis of Disassembly
Within this entry point, the following code is disassembled from the binary:
                **************************************************************
                *                          FUNCTION                          *
                **************************************************************
                undefined _start()
undefined         AL:1           <RETURN>
undefined8        Stack[-0x10]:8 local_10          XREF[1]:     0040121e(*)
                _start                             XREF[4]:     Entry Point(*), 00400018(*),
                                                                004020c8, 00402158(*)
00401210 31 ed           XOR        EBP,EBP
00401212 49 89 d1        MOV        R9,RDX
00401215 5e              POP        RSI
00401216 48 89 e2        MOV        RDX,RSP
00401219 48 83 e4 f0     AND        RSP,-0x10
0040121d 50              PUSH       RAX
0040121e 54              PUSH       RSP=>local_10
0040121f 49 c7 c0        MOV        R8=>FUN_004018e0,FUN_004018e0
         e0 18 40 00
00401226 48 c7 c1        MOV        RCX=>FUN_00401880,FUN_00401880
         80 18 40 00
0040122d 48 c7 c7        MOV        RDI=>FUN_00401300,FUN_00401300
         00 13 40 00
00401234 ff 15 b6        CALL       qword ptr [->__libc_start_main]  undefined __libc_start_main()
         2d 00 00
0040123a f4              HLT
The above code populates a number of registers, 3 of which are populated with function pointers, and then calls
the __libc_start_main function, which, as its name suggests, calls the actual main function of the program,
as defined by the author.
Reference Material
This is where we get into the details on needing reference material. For this particular scenario, the
Linux Standard Base Specification can be helpful for answering our questions
about what is going on here. In the above link, find the most recent specification, and choose the Core link
for whichever format you’re most comfortable with - I chose the HTML version. There’s a section named Base Libraries
which contains some documentation about the base libraries expected to exist on any Linux system that adheres to this base
specification. The link for Interface Definitions for libc will direct you to a Table of Contents for symbols exported
by the standard system C library runtime. In here, you should be able to find the documentation for the __libc_start_main
function:
Reviewing the documentation, you can see that the function is defined as:
int __libc_start_main(int (*main) (int, char **, char **), int argc, char ** ubp_av,
                      void (*init) (void), void (*fini) (void), void (*rtld_fini) (void),
                      void (*stack_end));
There are a number of arguments, but looking at the function prototype definition, as well as reaing the documentation,
it becomes clear that the first argument is likely the main function.
In doing analysis, you will often find that you’ll have to employ a mix of references from both machine instruction manuals as well as system-level API macnuals. This is because there’s much more to the structure of your program than what the CPU dictates. The Operating System it is running under has at least as much influence over the low level organization of the program as the CPU.
Some examples that are really handy for malware analysis:
- Microsoft Windows APIs (Win32, WinRT, .Net)
- JavaSE API from Oracle
- Android/Dalvik API Reference
- Apple Development Archives
Update the Function Signature / Type
We can then look at the Decompile view, to see which function pointers are provided as arguments, using a much more straightforward prsentation than the disassembly allows:
void _start(undefined8 param_1,undefined8 param_2,undefined8 param_3)

{
  undefined8 in_stack_00000000;
  undefined auStack8 [8];

  __libc_start_main(FUN_00401300,in_stack_00000000,&stack0x00000008,FUN_00401880,FUN_004018e0,
                    param_3,auStack8);
  do {
                    /* WARNING: Do nothing block with infinite loop */
  } while( true );
}
From the above, the function pointer FUN_00401300 corresponds to this first argument, so it is likely the main
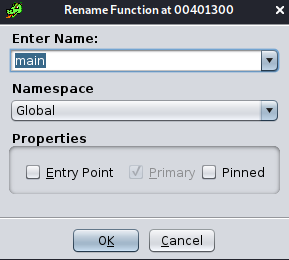
function. Double-click on FUN_00401300 to navigate to this function in the disassembly and decompiler views. Within
the disassembly Listing view (the central, main view), right click on the name FUN_00401300 and choose Edit
Label. This brings up a new window within which you can change the function name. Similar to before, when we modified
it in the Symbol Tree, this modifies every reference to that function, so that Ghidra will behave as if this
function was named main all along.
While here, another thing that will be helpful to us is to modify the function signature for main. While we know
that main is traditionally defined as int main(int argc, char **argv), or similar, Ghidra seems to have defined
this function as:
ulong main (undefined4 param_1, undefined8 param_2)
We can right-click on the function’s name in the Decompiler view and choose the option to Edit Function Signature.
This will pop up a window, in which we can free-hand edit the function signature in the top textbox. The table displayed
beneath it displays the function argument types, as well as which registers they must be passed in to the function (this
is the reason for all those register assignments earlier). Modify the function signature such that it uses the one I
listed earlier, as the typical main function signature, so that the dialog contents look like this:
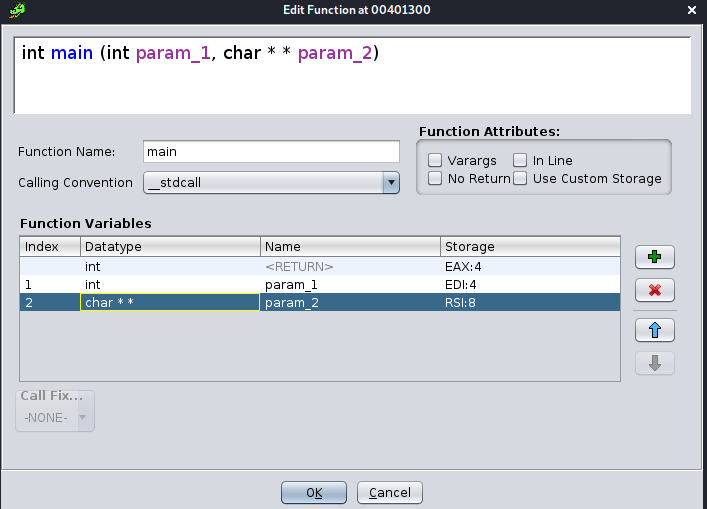
Note that in order to get the arguments table to update, you may need to click within it first. An alternate way to edit this signature is to double click in any of the cells in the table. The table also allows you to add or remove arguments, as well as move them up or down in the order. Once you click Ok, you’ll observe some minor changes occurring in other viewports, as Ghidra updates to accommodate your function signature change.
Code Representation
Unlike IDA, Ghidra has a decompiler built in as a core feature of the software. Ghidra accomplishes this by extracting disassembly from the provided binary file, and then this disassembly is translated to a generic instruction set that’s specific to Ghidra, named P-Code. This P-Code is then used to perform the translation to decompiled source code (for C, C++, Dalvik, and Java). This also can have further implications for re-targetting, or attempting to translate a binary from one architecture to another.
The Ghidra pipeline to decompilation is described below.

To perform the conversion from native machine code to P-Code, Ghidra implements a translation definition language called SLEIGH. Each of the processors that Ghidra supports utilize one or more “SLEIGH specifications” to perform the 2nd stage translation from Disassembly to P-Code.
The CPU specifications defined for Ghidra are located in the Ghidra/Processors folder of the project.
Two examples:
- The simple Intel 8085 SLEIGH
- The more complex x86/x86-64 SLEIGH - spread
across multiple files ending in
*.slaspecand*.sinc.
Revealing P-Code
By default, Ghidra hides the P-Code representation from us. If we want to we can reveal it in the Listing view, by first clicking the Edit Listing Fields in the top-right corner of the Listing view.
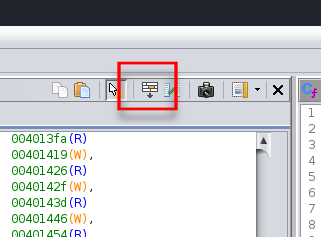
This will reveal a bunch of tabs at the top of the Listing view. Select the one labeled Instruction/Data, and it will reveal a UI that appears to be a bunch of gray buttons organized in rows with various labels. Most of these will have black text, but in mine, the one labeled PCode shows up greyed out, as it is disabled (hidden) from view.

Right clicking on it brings up a menu that allows you to choose Enable Field to activate it for display in the listing. Doing this will also highlight why this feature is hidden from view by default: for each machine instruction, there are often 3 or more PCode instructions that it evaluates to, resulting in it increasing the vertical size of the disassembly listing view by 3x-5x.
The following screenshot of a portion of the main function we labeled earlier highlights this:
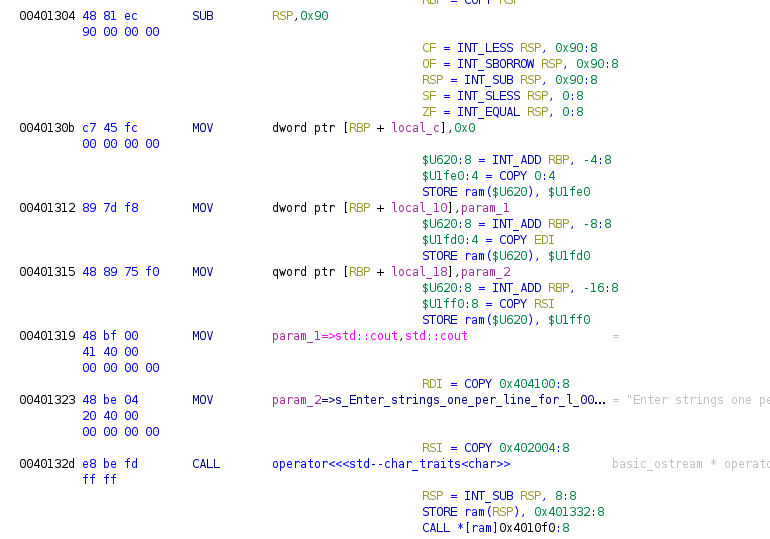
In the above example, you can observe that 3 of the MOV instructions (which roughly perform an assignment in C,
the = operator) each expand to 3 PCode instructions, due to the use of memory+register addressing modes that
employ RSP + variable. Likewise, the 2 MOV instructions that don’t use indirect addressing simply evaluate
to single PCode instructions. The SUB instruction at the top of the image evaluates to 5 PCode instructions,
though 4 of these are simply to update the CPU state. Finally, the CALL instruction at the bottom of the image
demonstrates how the function calling semantics of the x86 architecture are not shared among other architectures
and therefore, two additional PCode instructions need to be added in order to save the next instruction’s address
on the x86 CPU’s stack, so that when the function reaches the equivalent of a C return command, it knows where
to go after the function completes.
Continued In Next Post
This entry is continued in the next post
tags: malware lecture c x86 x86-64 asm cfg ghidra