Android Static Analysis Part 2
by Coleman Kane
In the previous lecture, we focused on introducing Android apps, a cursory analysis of their file structure, and how to use a few utilities to navigate the artifacts and get a greater understanding of an APK you might be looking at. In this lecture, I will cover using Ghidra for static analysis, and Android Studio plus its VMs to perform dynamic analysis, as well as some additional Android-specific static analysis.
For these examples, I will use the syssecApp.apk discussed in
this older walk-through:
- syssecApp.apk (download from my GDrive) - password: cs6038
Initially Gather Metadata about the APK
Using the apktool utility from the previous lecture, we can gain some insight into the nature of the
Android app.
Its permissions usage section from AndroidManifest.xml:
<uses-permission android:name="android.permission.READ_SMS"/>
<uses-permission android:name="android.permission.RECEIVE_SMS"/>
<uses-permission android:name="android.permission.READ_USER_DICTIONARY"/>
<uses-permission android:name="android.permission.INTERNET"/>
<uses-permission android:name="android.permission.READ_CONTACTS"/>
<uses-permission android:name="android.permission.ACCESS_FINE_LOCATION"/>
<uses-permission android:name="android.permission.READ_CALENDAR"/>
<uses-permission android:name="com.android.browser.permission.READ_HISTORY_BOOKMARKS"/>
<uses-permission android:name="android.permission.WAKE_LOCK"/>
<uses-permission android:name="android.permission.RECEIVE_BOOT_COMPLETED"/>
<uses-permission android:name="android.permission.READ_PHONE_STATE"/>
<uses-permission android:name="android.permission.ACCESS_NETWORK_STATE"/>
<uses-permission android:name="android.permission.READ_CALL_LOG"/>
<uses-permission android:name="android.permission.WRITE_CALL_LOG"/>
The main entry point of the application is identified as the class de.rub.syssec.amazed.AmazedActivity:
<activity android:label="@string/app_name" android:name="de.rub.syssec.amazed.AmazedActivity"
          android:screenOrientation="portrait" android:theme="@android:style/Theme.NoTitleBar">
Additionally, there are a number of other entry points defined as classes triggered by some of the
actions that the permissions above represent, as well as some service classes that are also
defined:
<receiver android:name="de.rub.syssec.receiver.SmsReceiver">
    <intent-filter android:priority="100">
        <action android:name="android.provider.Telephony.SMS_RECEIVED"/>
    </intent-filter>
</receiver>
<receiver android:name="de.rub.syssec.receiver.OnbootReceiver">
    <intent-filter>
        <action android:name="android.intent.action.BOOT_COMPLETED"/>
        <action android:name="android.intent.action.QUICKBOOT_POWERON"/>
    </intent-filter>
</receiver>
<receiver android:name="de.rub.syssec.receiver.OnAlarmReceiver"/>
<service android:name="de.rub.syssec.neu.Runner"/>
<service android:name="de.rub.syssec.neu.PositionService"/>
In the above, it looks like we have a class that gets executed whenever an SMS is received, so that
the backgrounded app can get real-time access to SMS messages upon receipt. Likewise, there’s another
class that gets executed when the device boots up. Finally, there’s another “receiver “entrypoint called
de.rub.syssec.receiver.OnAlarmReceiver that is registered as well. In addition to those, there are
two service classes that are also registered, which may act as additional entry points into the
application.
Compared to traditional system applications that you have on your Windows system, Android apps may be integrated with many ways to run code from the OS. In Windows, you’re mostly familiar with running an application by typing its filename on the command line, or double-clicking it in explorer. Both of those actions perform the same outcome - the program starts executing native code at the single entry point that is registered within the application headers. In short, while traditional Windows and Linux programs will often have a single entry point, mobile apps can have code executed from many different entry points, some of which that can even be isolated code paths independent of the primary on-screen app.
From the above, we have identified as the primary on-screen application entry point:
de.rub.syssec.amazed.AmazedActivity
As well, we have identified the following additional supporting entry points:
de.rub.syssec.receiver.SmsReceiver
de.rub.syssec.receiver.OnbootReceiver
de.rub.syssec.receiver.OnAlarmReceiver
de.rub.syssec.neu.Runner
de.rub.syssec.neu.PositionService
Opening the DEX file in Ghidra
Like Java *.class files, the *.dex files that contain the bundled ART compiled classes can be
loaded into Ghidra. Unlike Java, the fact that *.dex files are a bundle of compiled classes, we can
reap the benefit of being able to explore all classes within the same Ghidra analysis window. One
caveat is that importing the DEX files into Ghidra is not exactly straightforward. First of all,
Ghidra seems to sometimes identify DEX files as another type of archive, rather than a Dalvik binary.
This causes the archive import support to fail, and also requires you to override the file type auto
detection on import. Not certain why this is a problem as recently as Ghidra 9.1.2, but hopefully it
is an issue that will be resolved in future releases.
To work around these deficiencies, we need to manually extract the DEX files (the * is escaped
below so that it doesn’t get expanded by bash into any *.dex files in the current working
directory):
mkdir -p syssecApp-dex
cd syssecApp-dex
unzip ../syssecApp.apk \*.dex
In this case, there will be one classes.dex, but other apps have been known to have more, so it
is important to not assume classes.dex is the only file with compiled ART classes.
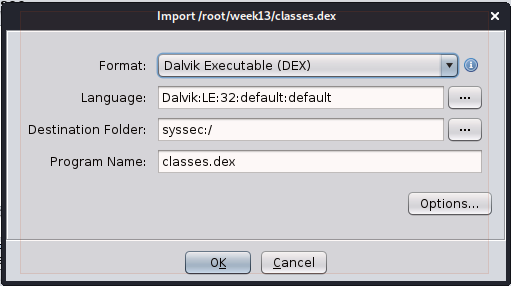
Once extracted, you can go through the standard process for creating a project. Once you import the
classes.dex, you’ll be presented with the familiar dialog which you encountered when analyzing the
JAR in Ghidra. In this case, you’ll want to choose the “Single File” option. You should then see
the import dialog, similar to below, with the Dalvik Executable (DEX) option selected.
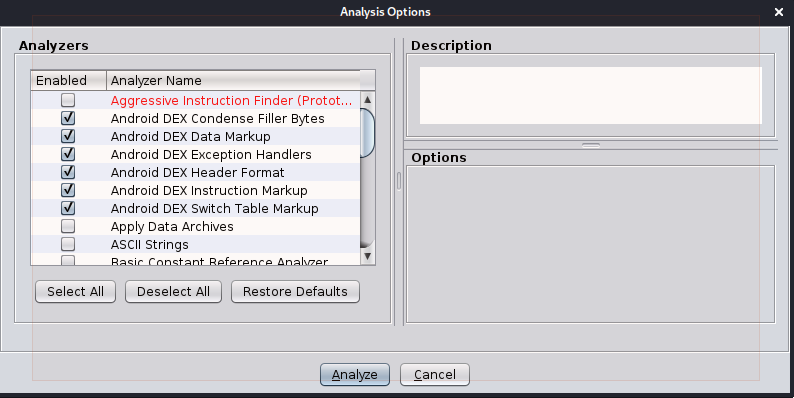
When the Analysis Options window pops up, you’ll be able to see a number of Android-specific options appear, that aren’t in this dialog for other file types. Feel free to click on each one to read more about them.
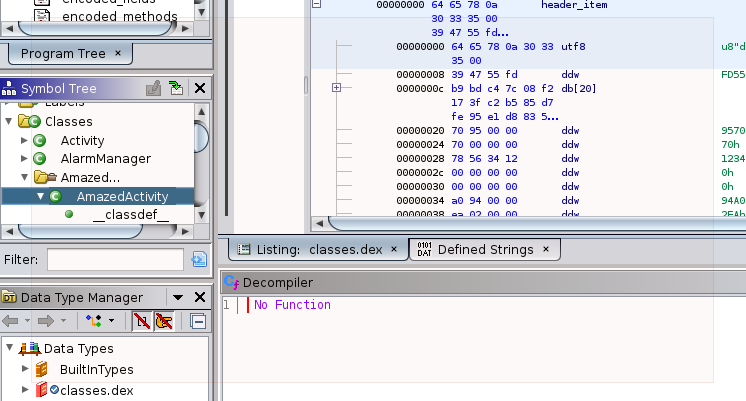
Ghidra should go through the normal battery of analysis steps. Next, you can navigate to the
Symbol Tree view, and expand the Classes section of it. Unlike the JAR archives, where Java
classes are spread across *.class binaries, all of the classes for the DEX bundle are navigable
here in the same view.
Navigating down to the onCreate method within the AmazedActivity class gives us the following
decompiled code. Android applications are built using an event-driven architecture. For this
reason, you’ll find that many classes that perform work contain a number of methods implemented
that begin with on-. In this case, we have onCreate, onPause, and onResume.
/* Class: Lde/rub/syssec/amazed/AmazedActivity;
   Class Access Flags:
    ACC_PUBLIC

   Superclass: Landroid/app/Activity;
   Source File: AmazedActivity.java

   Method Signature: V( Landroid/os/Bundle;
     )
   Method Access Flags:
    ACC_PUBLIC

   Method Register Size: 11
   Method Incoming Size: 2
   Method Outgoing Size: 7
   Method Debug Info Offset: 0x85e5
   Method ID Offset: 0x1a54
    */

void onCreate(AmazedActivity this,Bundle savedInstanceState)

{
  long lVar1;
  Object ref;
  PendingIntent pPVar2;
  Context pCVar3;
  AmazedView ref_00;
  Intent ref_01;

  super.onCreate(savedInstanceState);
  ref = this.getSystemService("alarm");
  checkCast(ref,AlarmManager);
  ref_01 = new Intent(this,OnAlarmReceiver);
  pPVar2 = PendingIntent.getBroadcast(this,0,ref_01,0);
  lVar1 = SystemClock.elapsedRealtime();
  ref.setRepeating(2,lVar1 + 10000,15000,pPVar2);
  this.requestWindowFeature(1);
  pCVar3 = this.getApplicationContext();
  ref_00 = new AmazedView(pCVar3,this);
  this.mView = ref_00;
  ref_00 = this.mView;
  ref_00.setFocusable(true);
  this.setContentView(this.mView);
  return;
}
The android documentation has a great explanation discussing how all of the activity onEvent methods work:
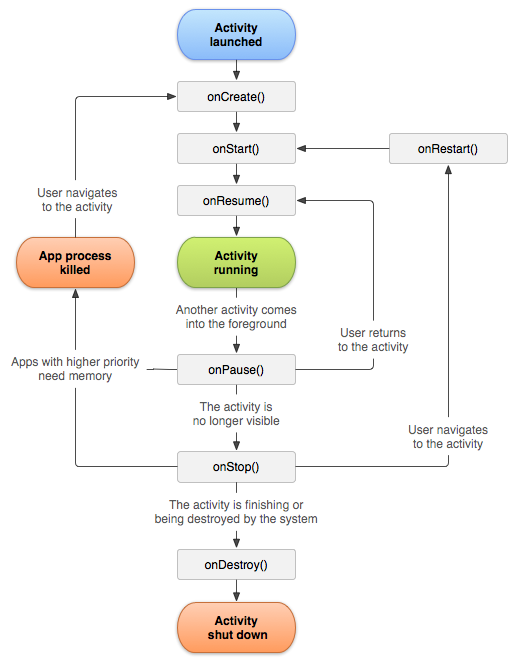
A great example is diagrammed above, documenting how the foreground focus switches will
send one app the onPause event, while the newly-foregrounded app will receive the
onResume method. Switching between apps on your mobile device triggers these events
to be sent to their respective apps.
Decompiled Code Analysis
From the code provided abobe, you can see there is code that makes use of the Alarm feature
that we identified in AndroidManifest.xml:
...
1 ref = this.getSystemService("alarm");
2 checkCast(ref,AlarmManager);
3 ref_01 = new Intent(this,OnAlarmReceiver);
4 pPVar2 = PendingIntent.getBroadcast(this,0,ref_01,0);
5 lVar1 = SystemClock.elapsedRealtime();
6 ref.setRepeating(2,lVar1 + 10000,15000,pPVar2);
...
The above code performs the following actions:
- Request a handle to a System Service,
named
alarmby the Android OS - Verify that the handle returned, and stored in
ref, is of typeAlarmManager(using acheck_castART/Dalvik/JVM instruction) - Creates a new Intent,
which is an Android API abstract object that describes a bundle of work to complete (a task),
and is registered to run the code in the
OnAlarmReceiverclass. - Instantiate a new
PendingIntentobject which is intended to perform a broadcast that will execute theIntentprovided in #3, within the current app context. - Get a the current system time in
iVar1(used for calculation of relative timestamp, next) - Set a [repeating alarm](https://developer.android.com/reference/android/app/AlarmManager#setRepeating(int,%20long,%20long,%20android.app.PendingIntent) that will perform the broadcast created in #4, to trigger initially at ~10 seconds from now, and then every 15secs after that
One of the interesting things that should start becoming readily apparent here is that a lot more of your analysis effort will be spent performing analysis at the SDK and API layer, rather than the machine code layer (which was the case with the x86 Windows malware that was analyzed before).
Function Call Relationship Analysis
Also, in the above code you may notice that there’s an instance of AmazedView that is
constructed, and then presented to the user:
this.requestWindowFeature(1);
pCVar3 = this.getApplicationContext();
ref_00 = new AmazedView(pCVar3,this);
this.mView = ref_00;
ref_00 = this.mView;
ref_00.setFocusable(true);
this.setContentView(this.mView);
From this source, we can use intuition to recognize that AmazedView is likely another
class that is defined within this application. This guess can be verified by using the Symbol
Tree to look for it. For longer functions, this can be tedious, so we can use a feature
within Ghidra to analyze the call tree named Function Call Tree or Function Call Graph.
If you navigate to the Window menu and select the Function Call Trees option, you’ll be presented with a new pane that outlines the function call relationships.
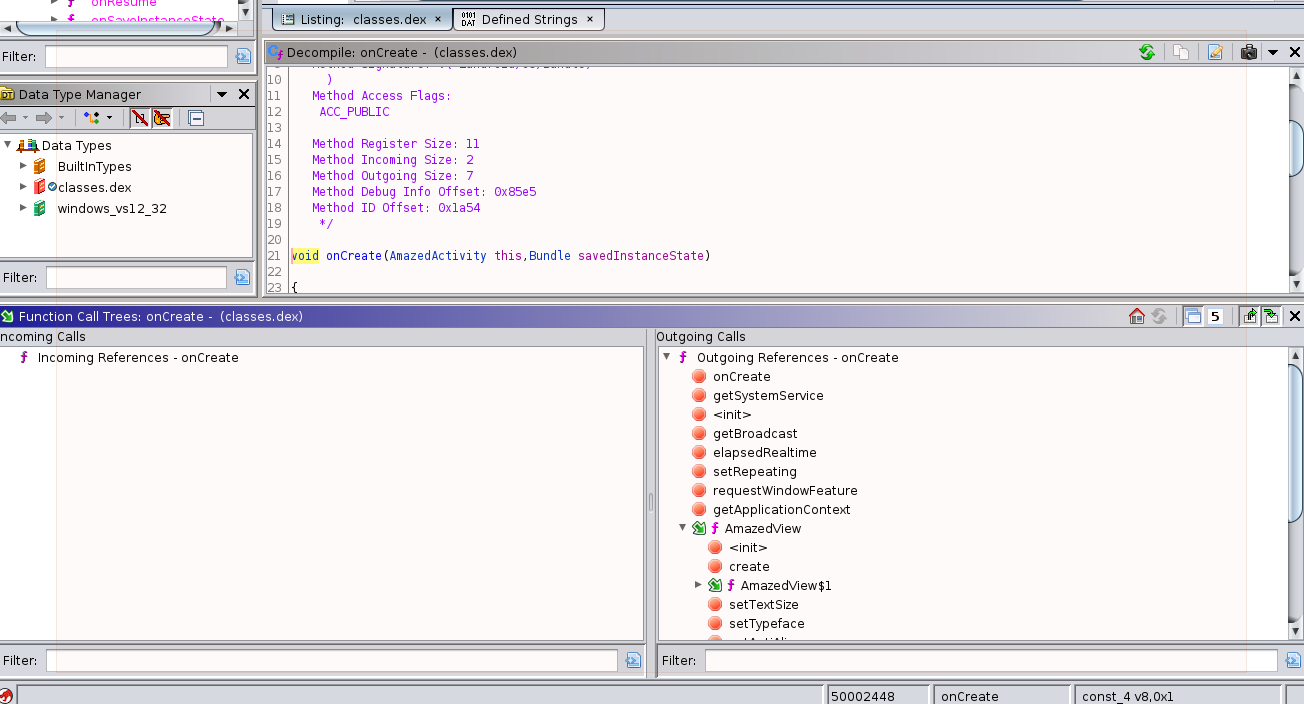
In the above, we can see a short list of the functions that are called, as well as some of
the classes that are instantiated within onCreate. If you use the Symbol tree to select
another function from the class, it will update this view with that content as well. The
class names are really referencing constructor function calls within this tree view. The
externally-defined functions have the red “stop sign” icon, while the locally defined ones
have the green down-right icon with the scripted “f” next to them. This helps distinguish
functions that you can explore with the disassembly and decompiler from those which are not
available without importing more files into the Ghidra project. In the code above, I have
already expanded the ActivityView() constructor, to also show the function calls that are
made within its code.
On one of the green-marked functions (such as AmazedView or AmazedView$1 in the graphic
above), you can right click to bring up a context menu, and choose Go To Call Destination
to view the disassembly and decompiled Java source for that function. Nicely, this doesn’t
change the view in the Function Call Trees window, making it easy to use this interface to
quickly preview functions to find what you’re looking for.
Another view built using this data is the Function Call Graph, which allows you to explore the same data, but using a visual directed graph representation that is dynamically expanded, as needed, during analysis. Don’t confuse this with the Function Graph which we’ve used in the past and merely diagrams the disassembly for a single function.
- Function Graph: Diagrams the execution flow between blocks of code within a single function
- Function Call Graph: Diagrams the execution flow between multiple functions, by using the “A() calls B()” relationships.
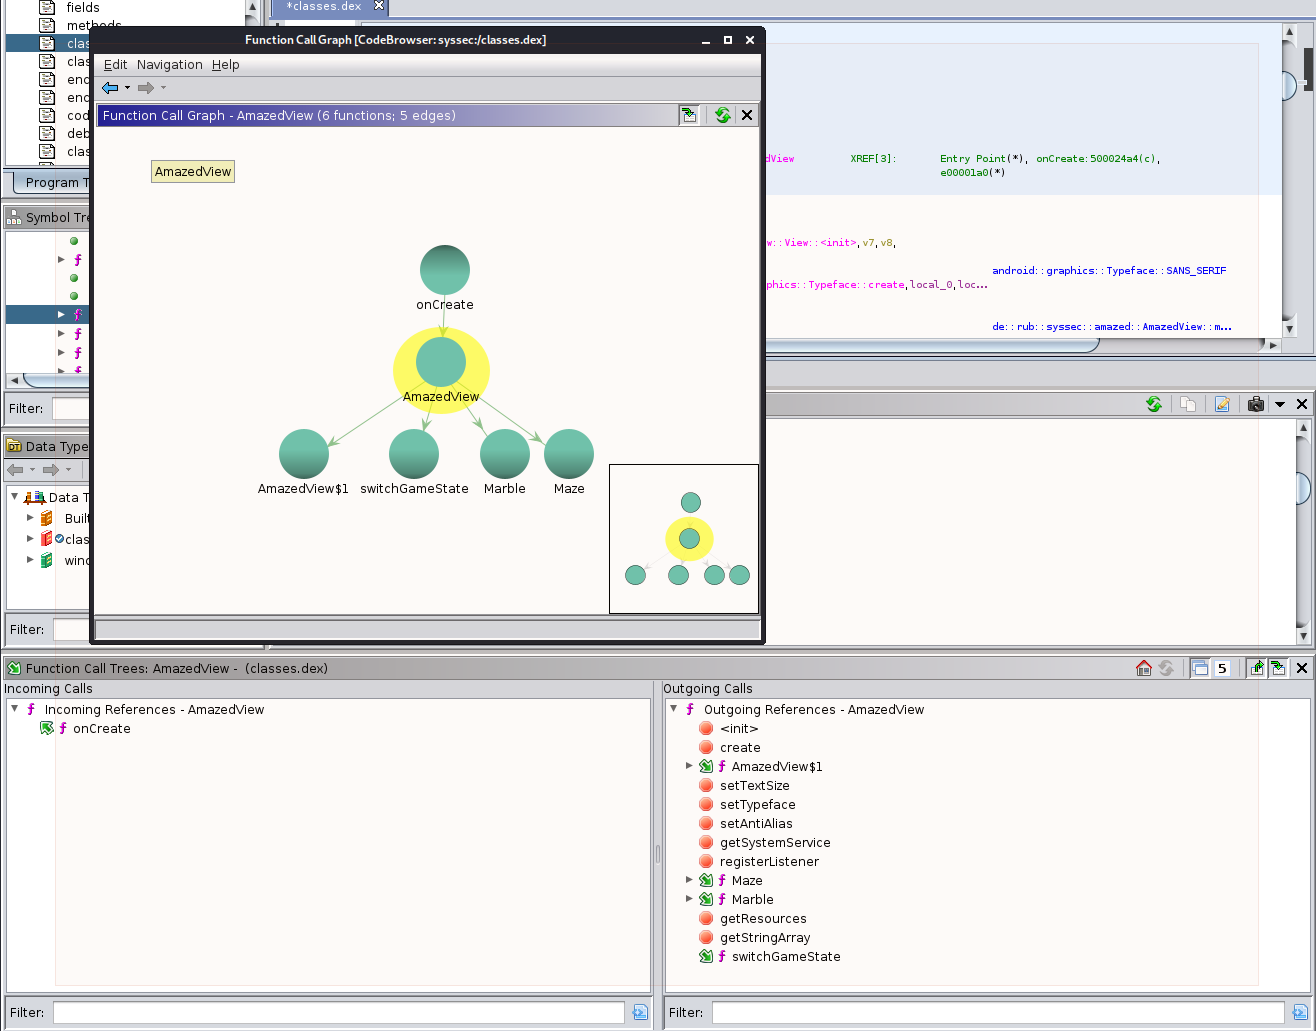
In the diagram above, I loaded up the Function Call Graph window and it first just had
the current function onCreate with an edge pointing at the ActivityView constructor.
Double-clicking on ActivityView caused the view to expand the ActivityView node’s
calls as well, producing this graph. Single-clicking on any node will highlight it, and
also will mave viewable one or two +/- icons, which will only be shown if there are
more nodes to expand. These toggle expanding or collapsing the adjacent nodes, with the
toggle in the top half of the node acting on the incoming call nodes (the callers), and
the toggle in the lower-half of the node toggling the view of the outgoing (or callee)
nodes.
Indirect Calls
One challenge presented to the analyst is that this only diagrams the direct calls, but not the indirect calls. An indirect call is a type of call where the final object type may not be evaluated until run-time, with the compiled-in type information primarily being abstract interfaces.
A great example is in the code that we analyzed briefly that set up the broadcast alarm for 15 second intervals:
ref = this.getSystemService("alarm");
checkCast(ref,AlarmManager);
ref_01 = new Intent(this,OnAlarmReceiver);
pPVar2 = PendingIntent.getBroadcast(this,0,ref_01,0);
lVar1 = SystemClock.elapsedRealtime();
ref.setRepeating(2,lVar1 + 10000,15000,pPVar2);
In the code above, OnAlarmReceiver is a class defined within this application that
contains the code that the author wishes to execute every 15 seconds. However, if we
explore that class using the Symbol Viewer, we will be able to see that there are
2 functions implemented within this class:
OnAlarmReceiver- the constructoronReceive- an event method, which is defined inBroadcastReceiver
Looking at this second function, particularly the comments that were added by Ghidra,
we can see that the parent class of OnAlarmReceiver is, in fact, BroadcastReceiver:
/* Class: Lde/rub/syssec/receiver/OnAlarmReceiver;
   Class Access Flags:
    ACC_PUBLIC

   Superclass: Landroid/content/BroadcastReceiver;
   Source File: OnAlarmReceiver.java

   Method Signature: V( Landroid/content/Context;
    Landroid/content/Intent;
     )
   Method Access Flags:
    ACC_PUBLIC

   Method Register Size: 5
   Method Incoming Size: 3
   Method Outgoing Size: 3
   Method Debug Info Offset: 0x8f52
   Method ID Offset: 0x1da4
    */

void onReceive(OnAlarmReceiver this,Context context,Intent intent)

{
  Intent ref;

  WakefulIntentService.acquireStaticLock(context);
  ref = new Intent(context,Runner);
  context.startService(ref);
  ref = new Intent(context,PositionService);
  context.startService(ref);
  return;
}
Looking at the documentation linked in the BroadcastReceiver hyperlink above, it can
be found that the function signature is defined as an abstract method, which basically
means that it defines this as a method that needs to exist in subclasses, but doesn’t
actually have an implementation in the Android library code.
public abstract void onReceive (Context context,
                                Intent intent)
Thus, when the Android API is executing the code within the OnAlarmReceiver,
the API doesn’t have any direct call link to the code we are analyzing right now, so
the Ghidra static analyzer cannot construct a call graph or tree for this code. We
must do that work by hand, or programmatically, which we have done now. We managed
to manually connect the dots between AmazedActivity to OnAlarmReceiver and now to
the following two classes that are called from OnAlarmReceiver.onReceive:
RunnerPositionService
You may remember both of these class names, as they were referenced in
AndroidManifest.xml at the beginning of this module:
<service android:name="de.rub.syssec.neu.Runner"/>
<service android:name="de.rub.syssec.neu.PositionService"/>
In this case, this code performs the work of creating and starting both services. We
can look into the Runner class - a good place to start is the constructors. Looking
at them both, the one that takes no arguments is empty, but the one that takes another
Runner as an argument contains the following code:
void Runner(Runner this)

{
  this.WakefulIntentService();
  this.sendToHost = "127.0.0.1";
  this.sendToPort = 0xd0df;
  this.xml = null;
  this.startDate = 0;
  return;
}
Some interesting data here as there’s an IP address that is assigned to the sendToHost
member variable, as well as a port 0xd0df. Using Ghidra you can convert this to an
Unsigned Decimal value and see that it is 53471. (note that the “localhost” IP of
127.0.0.1 was merely chosen as a “safe” example value for this exercise).
Looking at the Runner class, there are a number of interesting methods that are
implemented. Implemented methods show up on the list with the purple “f” icon, while
inherited methods, those which aren’t implemented in this class, but instead just
use the parent class implementation, have a green bubble icon next to them:
addResultsetToXml
doWakefulWork
dumpSMS
getGeneric
isOnline
prepareSend
readBrowserBookmarks
readBrowserSearches
readCalendar
readCallLog
readContacts
readDictionary
Runner
Runner
sendData
steal
work
Some very curious method names stand out, indicating some activity that’s likely suspicious.
dumpSMS
read*
sendData
steal
work
So, we can quickly use the method we performed earlier to graph out the call graph, starting
from one of these (I began from work). If the graph nodes are spread too far out to fit
on screen, feel free to manualy click and drag to rearrange it for you to see everything at
once, as I have done.
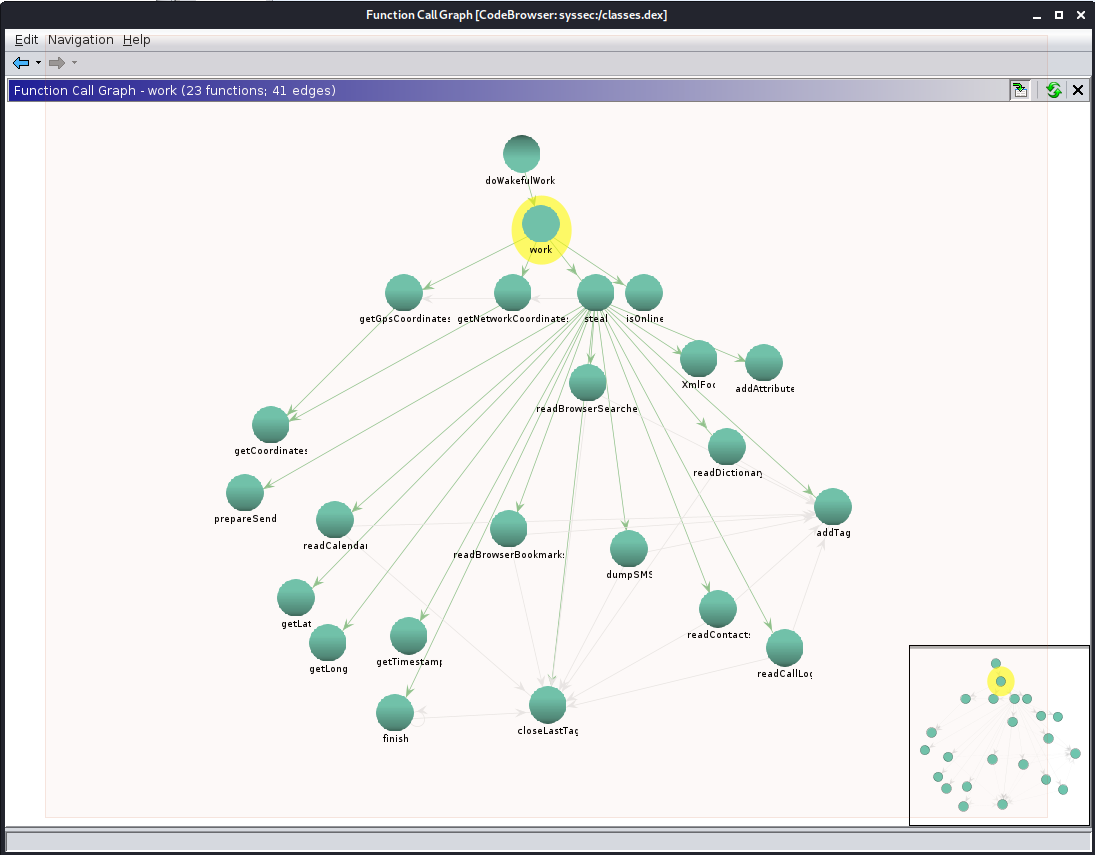
Looking at this graph, it becomes clear that steal ends up calling the following list of
functions that have decriptive enough names to indicate what actions they’re performing:
readCalendargetLat/getLong(likely GPS coordinates)getTimestampgetBrowserBookmarksreadBrowserSearchesdumpSMSreadContactsreadDictionaryreadCallLog
Sometimes when doing this work in the real world, you might not have the luxury of
easy-to-read function names prepared for you. In these cases, you likely might have
to exhaustively look at each of the functions - narrowed down, of course, to those
that are in the call-tree from important entry points, or that call networking code.
We can take an example of this with the readDictionary function: not sure what
dictionary is being stolen? Let’s find out…
Analysis of readDictionary
The decompiled source code for the function is below:
void readDictionary(Runner this)
{
  Context ref;
  ContentResolver ref_00;
  Cursor ref_01;
  XmlFoo local_1;
  String[] ppSVar1;
  Uri pUVar2;

  local_1 = this.xml;
  local_1.addTag("dictionary");
  pUVar2 = UserDictionary.CONTENT_URI;
  ref = this.getApplicationContext();
  ref_00 = ref.getContentResolver();
  ppSVar1 = new String[2];
  ppSVar1[0] = "word";
  ppSVar1[1] = "frequency";
  pUVar2 = Uri.withAppendedPath(pUVar2,"words");
  ref_01 = ref_00.query(pUVar2,ppSVar1,null,null,null);
  this.addResultsetToXml("entry",ref_01);
  ref_01.close();
  local_1 = this.xml;
  local_1.closeLastTag();
  return;
}
From this, we can gather some information about what the function appears to be doing in the system:
pUVar2 = UserDictionary.CONTENT_URI;
...
ref_01 = ref_00.query(pUVar2,ppSVar1,null,null,null);
this.addResultsetToXml("entry",ref_01);
We can look up UserDictionary
in the API documentation, and determine that it is part of the following feature:
A provider of user defined words for input methods to use for predictive text input. Applications and input methods may add words into the dictionary. Words can have associated frequency information and locale information.
This object is part of the predictive text entry system. All of those word recommendations you have when you are typing are informed by what you’ve typed in the past, and the Android OS makes this data available (by permission) to apps that are installed on the phone. A good opportunity exists in here to mine more data about the user of this mobile device, beyond what has been retained in the other data sources (like SMS messages, browser history, etc.).
So, say we want to be a bit more descriptive of what this function does. We can
change the name of the function within our analysis session. Simply select the
function name readDictionary in the decompiled source or the disassembly, and
then hit the L key on the keyboard to re-Label the function name. A dialog will
pop up asking for a new name - I entered readPredictiveDictionary here. Once
you click “OK” it will change this function name everywhere it is referenced.
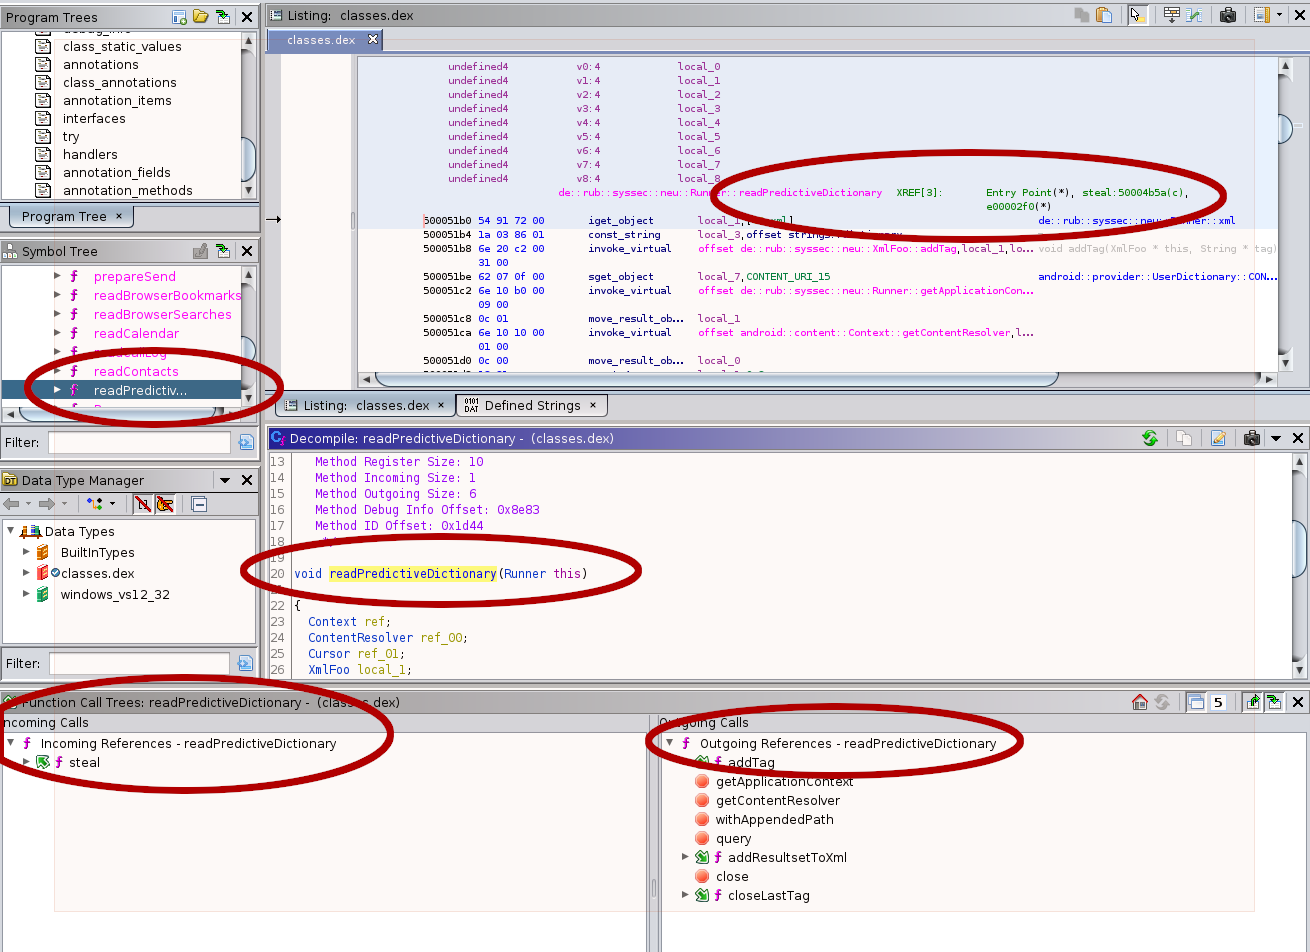
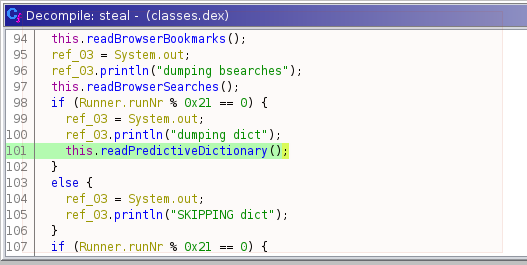
Additionally, if you navigate to the steal function and view its decompiled
source, you can also verify that the function name change has been made automatically
for you in other code that calls the readDictionary function. For example, below
is the line in steal() where this occurs:
This was a rather simplified example, as the original function name
readDictionary at least gave some hits as to what its purpose was. However,
a more complex anbd real-world example may have all of the data collection
functions renamed to random english words or even “step1, 2, 3”.
Ghidra gives you the ability to change the function name (and symbol name) in
one place and propagate that for you throughout the rest of the code, so you
can focus on walking through each one of the functions, and label them as you
go.
Some Considerations
This program contains a number of functions that are considered initial versions, which means that they are not overriding any parent-class functions. For type safety, and to maintain continuity of analysis it is recommended to stick with labeling functions that have an initial implementation in the artifact you’re analyzing. If you were to change the name of one of the functions inherited from a core Android Run Time library class, you’ll likely lose the inheritance relationship between the member function and its parent implementation, and you will also create more analysis confusion that way.
Since Java (and ART/Dalvik) maintains a high-level object oriented representation
in the compiled bytecode, there are limits to the obfuscation possibilities that
don’t exist in native-compiled code written in C or C++. For instance, this application
needs to interface, by class and function name, with numerous API interfaces within
the Android OS. If you go back over this post, and follow all of the links to
developer.android.com you will see many of them. These names cannot change (easily)
within the code and result in a program that performs the actions that the adversary
needs. Windows and the x86 systems often maintain a considerable number of
globally-fixed address locations for code and data, largely due to historical legacy
conventions. The JVM and ART virtual systems were constructed without the burden
of having to carry these legacy artifacts forward into modern software. This ends up
altering (somewhat) the analysis process you’ll use in Android and Java applications.
C#/Mono (.NET) applications also execute within a similar runtime called the MS Common Language Infrastructure. This is an international standard, and is defined in the below documentation:
As the CLI has roots in an earlier derivation of the Java Virtual Machine that Microsoft once pursued, analysis of applications written for it, and the capability of reversing that code is comparable to Java and Dalvik/ART.
Further Learning
Maddie Stone, from Google Project Zero, has published a series of Android Malware analysis talks here:
tags: malware android apk mobile ghidra lecture