Immunity Debugger View and Description
by Coleman Kane
The previous week introduced you to some of the Immunity Debugger interface, as well as offered 3 walk-throughs for Immunity Debugger. This week we will dive into a few analysis exercises that give you further tools that will be useful in Malware Analysis. I’ll give some demonstration code that illustrates some common challenges you’re likely to encounter in malware analysis, and how to use the tool to analyze and understand them.
First, I’ll do a short review of the features of Immunity Debugger.
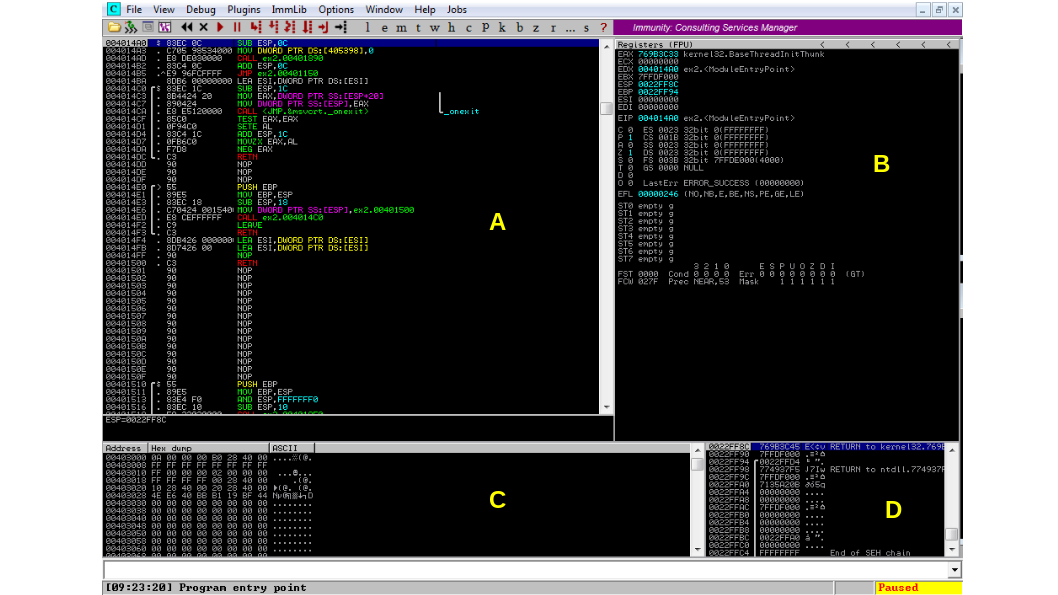
This is the view of Immunity Debugger when you first open up a new EXE file in it. It is divided up into 4 primary quadrants, which I have labeled above. It is important to remember that when the debugger starts up, the program it is analyzing is in “paused” mode, so it is taking no action and you can analyze it freely.
- A: The disassembly view - this displays the disassembly of the code you’re analyzing. By default, this is displays the current execution point for the CPU (the next instruction to execute and its surrounding code).
- B: The CPU state and registers. These represent the current state of the CPU, including the current register values.
- C: The “data view”. A view into the data portion of the program. For an EXE file, this
will display the first “
.data” section for the program. - D: The current program stack / heap. This displays the memory at and below the current
stack pointer (address stored in
ESP/RSP). You can view the current stack, as well as the data stored on the local heap in this view. The heap is marked with a helpful solid line between the address and data columns.
The Program Control Toolbar
Additionally, there is a toolbar above the disassembly view, which provides single-click access to a number of common functions.

From left to right, the graphic icons represent:
- Open a new file
- Display the Python scripting/command window
- Display a window that allows you to explore and execute “PyCommands” - Python scriptlets that provide helpful functionality and automation
- Display a function graph of the function including the current code
- Restart analysis (CTRL+F2) - restart the program from the beginning
- Close program (ALT+F2) - closes the program and discards analysis and memory data
- Run program (F9) - begins executing the program at normal speed
- Pause program (F12) - pause execution of the program, don’t discard state
- Step into (F7) - Will advance the program by one step (instruction), entering new functions
where a
CALLis encountered. - Step over (F8) - Will advance the program by one step (instruction), except that each function call will be considered a single instruction, and won’t be entered.
- Trace into (CTRL+F11) - Will execute the program, but record a trace of each instruction
visited, its register/memory accesses, and various other information. Will enter functions
to trace within them when encoutering a
CALL. - Trace over (CTRL+F12) - Will execute the program, but record a trace of each instruction
visited, its register/memory accesses, and various other information. When a function
CALLis encountered, it will treat it as a single instruction and not enter it. - Go to address: can be used to jump the assembler view to a specific address (but does not
change the
EIPvalue)
The Window Quick-Access Toolbar
Following these are 14 alphabetic buttons that display various windows:
- l: Show log. Immunity Debugger maintains a log of significant events as they’re encountered, as well as program state information, and other helpful notes. In the event that something is not behaving as anticipated, this may hold some clues.
- e: Show modules. Displays the “modules” loaded for this program. This generally includes the EXE plus any of the DLLs it imports. However, a running program can load a number of other modules of various types into memory at run-time, and these will also get listed here.
- m: Show memory. Each program has a dedicated virtual memory layout. This window can allow you to explore all of the memory that is available for the program to access.
- t: Show threads. All programs in Windows consist of one or more threads of execution. This view will display each of them, allowing you to follow different threads in the disassembly view and also see where all threads are currently executing.
- w: Show windows. Each program in Windows may have one or more windows (for the GUI) and these are managed by the operating system.
- h: Show handles. Similarly to windows, a number of other system-level objects are available to the program (such as file handles). This allows you to explore the different OS-level objects the program access and creates.
- c: Show CPU. Show the “CPU” view, which is the view we are currently looking at. There are a number of other windows available in Immunity debugger. It is easy to get lost, so this allows a quick way to jump back to the current execution view (this view).
- p: Show patches. Immunity Debugger offers a nice feature called “patching” which can allow you to modify code or data in memory, without affecting the file on disk. The debugger keeps track of these changes, and you can view them all here.
- k: Show Call Stack. This shows the current call stack of the executing code. If you find that you are buried multiple levels deep within called functions, this can help you determine what sequence of functions brought the program here, and how to navigate back out.
- b: Show breakpoints. Display the current breakpoints set in the debugger. Any debugger offers you the ability to set a number of types of “breakpoints” which are locations you set in the code that will force execution to pause if the memory or instruction they’re set on is encountered.
- z: Show hardware breakpoints. The CPU supports a limited set of hardware breakpoints as well, and this allows you to view and manage them. There are a few situations where these may be helpful, as they are not visible to the executing program the way that software breakpoints are.
- r: Show references. The references window contains the results of any referential search that was performed. For example, the SANS PDF and lab 5 described how to discover references to strings. The view of all of the strings would be one output displayed in the reference view.
- …: Show run trace. If you were tracing execution (with CTRL+F11/F12), the output would be placed in the run trace and you could view it and analyze it here.
- s: Show source. Display source code associated with the EXE, if available. The feature enables you to utilize Immunity Debugger similar to how you would utilize Visual Studio’s debugger or GDB. You’ll need a program with debugging symbols still intact, and you’ll need the source code.