Ghidra Intro
by Coleman Kane
The Ghidra reverse engineering suite consolidates a lot of functionality into a single tool. The second half of the lecture below goes on to explain very quickly some of the components in Ghidra, by relating them to the tools used in the previous post. If you’re using the Kali image I provided, you can open up the menu, navigate to section “07 - Reverse Engineering”, and select Ghidra from the list of utilities.
The following is same embedded video as was posted for the 2020-02-04 entry, just also duplicated here for convenience.
The Ghidra Analysis UI
After following the steps discussed Tuesday, and recorded in the video above, you should be able to load an EXE into the project, and open it up to work with in Ghidra’s analysis view, and finally wait for the Ghidra automated analysis work to complete. While the analysis is running, you’ll see an animated hourglass in the lower-right-hand corner. There is a screenshot below which I have annotated to identify 4 of the key UI widgets that we worked with in class, using large bold red letters:
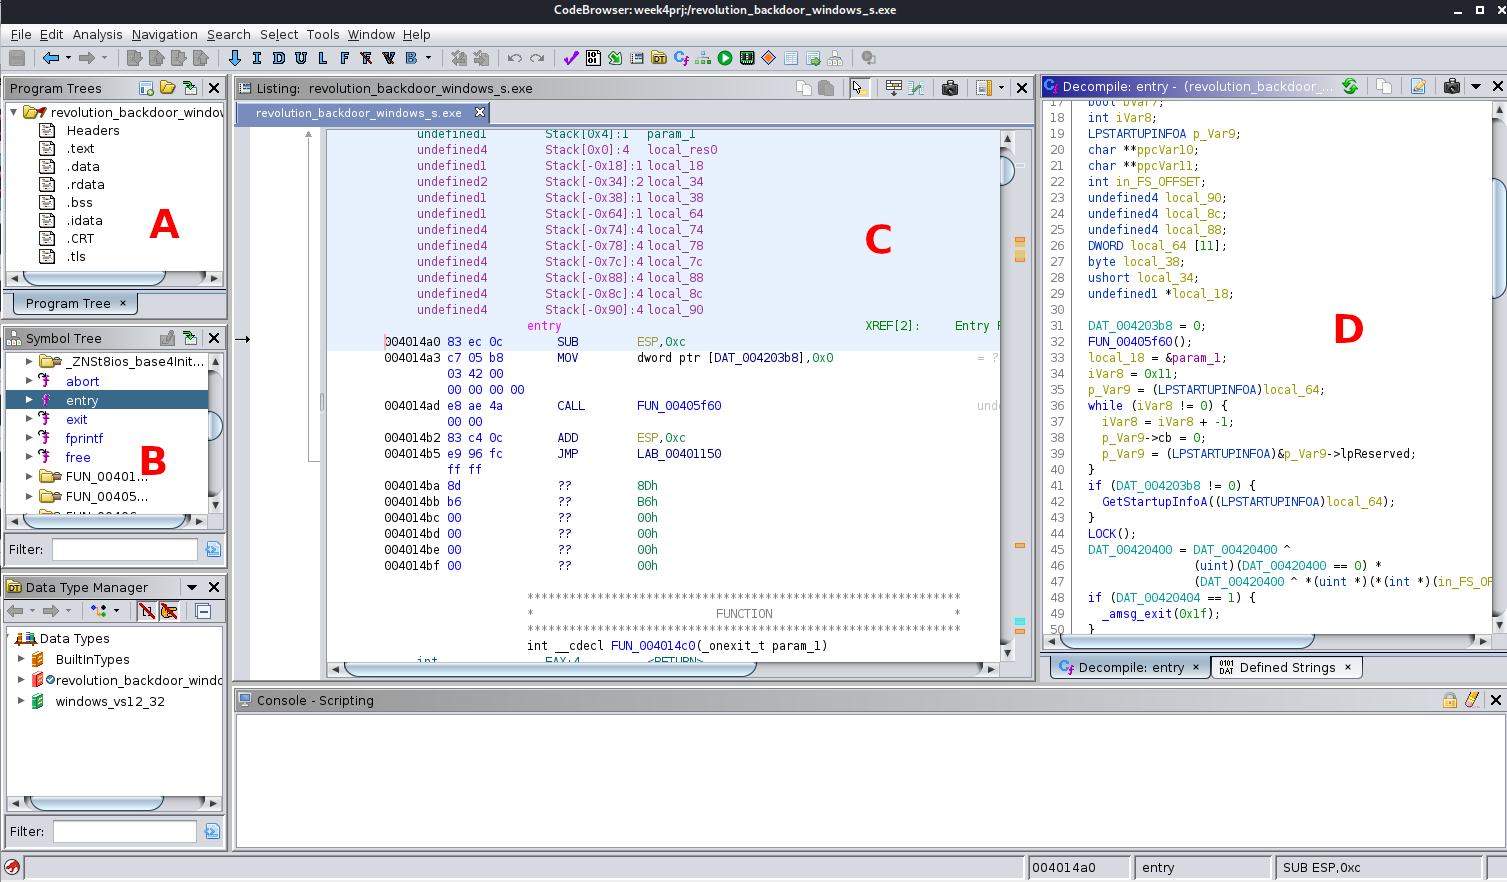
A) EXE file section layout
If you recall from the video, the EXE file is actually broken into sections, and a data structure within the EXE file contains the information to tell Windows how to load these sections into memory. This is the listing of those sections, and can be used for jumping around the different sections of the file in the disassembly/listing view.
This data is the same data listed in the Sections: portion of the objdump -x filename.exe output.
B) Symbol/function explorer
The symbol/function explorer is one of the most powerful features in Ghidra. It provides a tree-like alphabetic listing of all of the symbols that were identified in the executable binary, once analyzed. These include variable names, function names, class implementations, and more. This includes both the names of functions & variables external to the program, as well as those which are included within this program.
The Import Table maintains a list of the symbols that are referenced from external DLLs within this file, and on the command line
objdump -x filename.exe includes the Import table, every symbol, and which DLL (or other shared library type) it can be found in.
The command objdump -t filename.exe will list all of the symbols referencing code or data within the program. For this reason, it will
only work with the original, unstripped version of revolution_backdoor_windows.exe.
One thing to keep in mind is that, if functions don’t have a symbol attached to them (such as if they’ve been removed using strip), then
Ghidra will auto-assign a slightly-descriptive FUN_xxxxxxxx name, where xxxxxxxx will be the hexadecimal memory address of the beginning
of the function.
The example that I show in class uses a backdoor compiled from the following source code:
I have published a ZIPped copy of this binary to this link. The
password for this archive is cs6038. You may want to open the source code for revolution_backdoor_windows.cpp in your browser, and
then extract the EXE file into your Kali VM. Once there, you can remove the symbols using the following command (despite removing this data,
the program will work just the same):
strip revolution_backdoor_windows.exe
Next, open the above file up in Ghidra, after stripping it, and you will find that you can no longer find the functions named main,
isDirectoryExists, or StartsWith. Instead, you’ll find some branches of FUN_xxxxxxx-named functions.
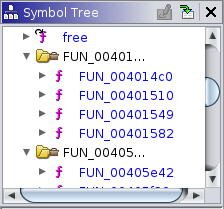
Ghidra automatically assigns this unnamed functions new names, so you can more easily work with them in the tool. What’s more, Ghidra
gives you the ability to change these names to anything you wish. In our case, let’s change the name of FUN_401510 to the correct
StartsWith function name.
If you right-click on the function name in the symbol navigator, you
can choose the Edit Function… option (pressing the “F” key with the function selected is a shortcut). You’ll be presented with a
dialog that allows you to modify the function’s prototype. Select the name of the function by double clicking on FUN_401510 in this
dialog, and then simply rewrite it by typing StartsWith, similar to if you were editing an MS Word document. Next, click “OK” and
Ghidra will propagate your changes throughout the project, updating all references to FUN_401510 so that they will now read StartsWith.
C) Disassembly view
The disassembly view is also called the “Listing” view, because it displays more than just disassembly. In parts of the file that store non-executable data, this Listing view attempts to depict the data and underlying data structures, where possible. As I demonstrated in the lecture, when data is encountered by the Listing view, it may provide you with duplicated presentations of the data so that you may view it in the different forms it may take within a program. Often this is helpful for analysis, as Ghidra may not be able to easily guess the best representation of the data.
Another thing that’s notable is that the Listing and the Decompiler views are locked to one another. So, if you place the cursor at a position within the listing, if it contains executable code, the corresponding function will be displayed in the decompiler view, and the line of code containing the seslected instruction will be highlighted.
One important thing of note is that the assembly code displayed here uses the “Intel Syntax”, while the assembly code displayed with
objdump -d or objdump -s is displayed using the “AT&T Syntax”. In addition to slight differences in operation and register names,
the operand order (the arguments the instruction acts upon) are reversed.
D) Decompiled view (reconstructed C/C++ code)
Ghidra has a unique capability in its high-end decompilation engine. By and large it does a great job decompiling your disassembly into readable C code, and often code that can be recompiled. The secret to this is that Ghidra has a machine code translator built in that will convert any supported machine code into a pseudo-instruction set known as PCODE. Some documentation of this is here:
For the example StartsWith function discussed above, the author’s code is here:
bool StartsWith(const char *a, const char *b)
{
   if(strncmp(a, b, strlen(b)) == 0) return 1;
   return 0;
}
The decompiled version extrapolated from the compiled machine code is here (including my small change from earlier):
uint __cdecl StartsWith(char *param_1,char *param_2)

{
  size_t _MaxCount;
  int iVar1;

  _MaxCount = strlen(param_2);
  iVar1 = strncmp(param_1,param_2,_MaxCount);
  return (uint)(iVar1 == 0);
}
Meanwhile, the 32-bit x86 assembly language looks like this:
    PUSH       EBP
    MOV        EBP,ESP
    SUB        ESP,0x18
    MOV        EAX,dword ptr [EBP + param_2]
    MOV        dword ptr [ESP]=>local_1c,EAX
    CALL       strlen

    MOV        dword ptr [ESP + local_14],EAX
    MOV        EAX,dword ptr [EBP + param_2]
    MOV        dword ptr [ESP + local_18],EAX
    MOV        EAX,dword ptr [EBP + param_1]
    MOV        dword ptr [ESP]=>local_1c,EAX
    CALL       strncmp

    TEST       EAX,EAX
    JNZ        LAB_00401542
    MOV        EAX,0x1

    JMP        LAB_00401547
LAB_00401542:
    MOV        EAX,0x0

LAB_00401547:
    LEAVE
    RET
The “Defined Strings” navigator
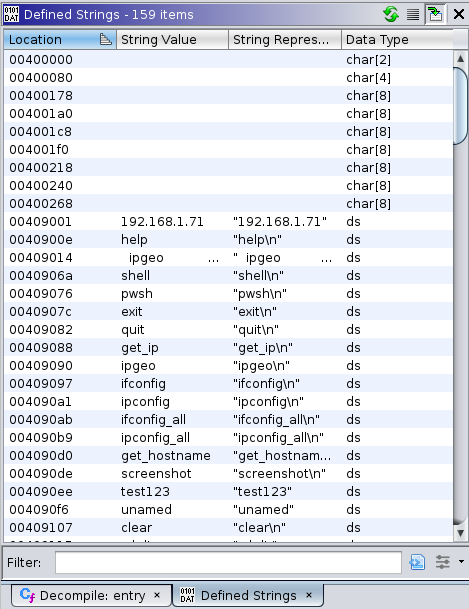
I demonstrated using the “Defined Strings” view, which in the earlier Ghidra diagram is a tab hidden under the
disassembly view marked with “D”. This view gives you a list of the strings identified in the file, using
discovery logic similar to the strings command-line tool.
Similar to the Decompiler view, the “Defined Strings” navigator will make the Listing view jump to the location of where the string is stored within the file. Unlike the decompiler view, selecting another line containing another string nearby doesn’t automatically move the selection in the Defined Strings view.
In the listing view showing the string data, there’s an “XREF” label to the right of each string’s starting
address (which also doubles as its variable name, auto-assigned with logic similar to the auto-function-naming we
explored and modified earlier). For instance, selecting the unamed string will jump to its definition, which
includes the following XREF information:
XREF[2]:      FUN_0401582:00403a9c(*),
              FUN_0401582:00403f04(*)
The above tells the name of the function that uses this data, and the exact postion (absolute within the program,
not offset from the beginning of the function) where the data is used. If you double-click on either of these, you’ll
be transported to the disassembly that references that data. The [2] next to XREF tells you there are 2 references
to the data within the program. In this case, both happen to occur within the same function, but this may not
always be the case.
Analysis Exercise
So, then next thing we are going to do is perform a short analysis to discover some information about a feature in
the program. Let’s start by opening up the “Defined Strings” view, and navigate down to and select the string
get_hostname from the list. This should position the listing cursor to highlight the following data:
                     s_get_hostname_004090d0           XREF[1]:     FUN_00401582:004036c5(*)
004090d0 67 65 74        ds         "get_hostname\n"
         5f 68 6f
         73 74 6e
Double-clicking on the text FUN_00401582:004036c5 will change the listing’s cursor position to the location within
the code where get_hostname is used by the program:
                     LAB_004036c5                                    XREF[1]:     00403599(j)
004036c5 c7 44 24        MOV      dword ptr [ESP + 0x4],s_get_hostname_004090d0    = "get_hostname\n"
         04 d0 90
         40 00
The above line of code copies the address of the first character, g, from get_hostname onto the address 4 bytes
above the bottom of the stack (32-bits, or one integer variable).
Looking a bit further, we will see the following lines follow:
004036cd 8d 85 1c        LEA        EAX,[EBP + 0xfffe8b1c]
         8b fe ff
004036d3 89 04 24        MOV        dword ptr [ESP],EAX
004036d6 e8 95 39        CALL       strcmp               int strcmp(char * _Str1, char *
         00 00
These three lines compute another pointer pointing at some local data from the heap, write that pointer into the
memory on the top of the stack, and adjacent to the memory write operation we just looked at earlier. A common
approach to managing local function memory is to allocate some space on the heap, and keep track of this space
using the EBP (32-bit) or RBP (64-bit) register. Finally, the
function strcmp is called, and reading the documentation,
we can tell that this function compares to strings for equality. In this situation, it appears that Windows passes
the arguments to the function using the stack, ESP register. The variations available in Windows are documented
here. Generally speaking, these won’t
be noted within the program, but Ghidra often may deduce them through auto-analysis. Barring that, it will often
be up to you to determine this through deciphering how argument handling occurs in context.
So, in a nutshell the 4 lines of code above compare some locally-stored temporary data to the string get_hostname,
and then likely will use that result to make a decision further down.
Next, lets look a little bit further down at what else this code will proceed to do. The next two lines read:
004036db 85 c0           TEST       EAX,EAX
004036dd 0f 85 2a        JNZ        LAB_0040380d
         01 00 00
This performs a test of the result against itself. The TEST instruction performs a bit-wise AND operation,
discarding the result but retaining the CPU flags state. In this regard, it is similar to the CMP operation
we saw in class and that operation’s relationship to the SUB instruction.
If the EAX register (which Windows Calling Convention will use to store the return value of a function) is
zero prior to the TEST, then, and only then, will the zero flag be set in the CPU state by the TEST. Thus,
if the two strings are equal, execution will continue after the JNZ. Otherwise, the JNZ sends the execution
to a part of the code that will handle if the strings don’t match. In a situation like this, it often will test
against another string in this event, effectively cascading down a long list of strings to compare to until it
exhausts the list.
Getting back to our example, lets follow what would occur if the string matches get_hostname:
004036e3 c7 85 6c        MOV        dword ptr [EBP + local_139c],0x2e646d63
         ec ff ff
         63 6d 64 2e
004036ed c7 85 70        MOV        dword ptr [EBP + local_1398],0x20657865
         ec ff ff
         65 78 65 20
004036f7 c7 85 74        MOV        dword ptr [EBP + local_1394],0x6820632f
         ec ff ff
         2f 63 20 68
00403701 c7 85 78        MOV        dword ptr [EBP + local_1390],0x6e74736f
         ec ff ff
         6f 73 74 6e
0040370b c7 85 7c        MOV        dword ptr [EBP + local_138c],0x656d61
         ec ff ff
         61 6d 65 00
00403715 c7 44 24        MOV        dword ptr [ESP + 0x8],0x44
         08 44 00
         00 00
0040371d c7 44 24        MOV        dword ptr [ESP + 0x4],0x0
         04 00 00
         00 00
The above is very interesting. If we look at it closely, we will notice Ghidra auto-declared 5 local variables,
each of which is exactly 4 bytes from another (as denoted by the numbers in the local_#### variable names). Laid
out, these each are right next to each other, and it appears to be writing these in a reverse order. One good thing
to keep in mind when looking at things like this is to remember that all 32-bit integers each represent 4 bytes,
and for some of the byte values there’s a human-readable character equivalent. The byte values that represent
human readable characters are 0x20-0x7f. So, whenever, you see a large sequence of writes, and you’re able to
discern (as is the case above) that all bytes in the data move operation are within this range, there’s a strong
likelihood that a string is being written into memory, four bytes at a time, here.
A useful list of the ASCII characters to their numeric byte mapping: asciitable.com
Ghidra has a helpful tool for examining data like this, called “data convertor”. You can choose any data displayed
in the listing view, and explore the different possible representations, and even change how the listing view
displays the data to the user. Right click on the data 0x2e646d63 in the first line and a menu pops up.
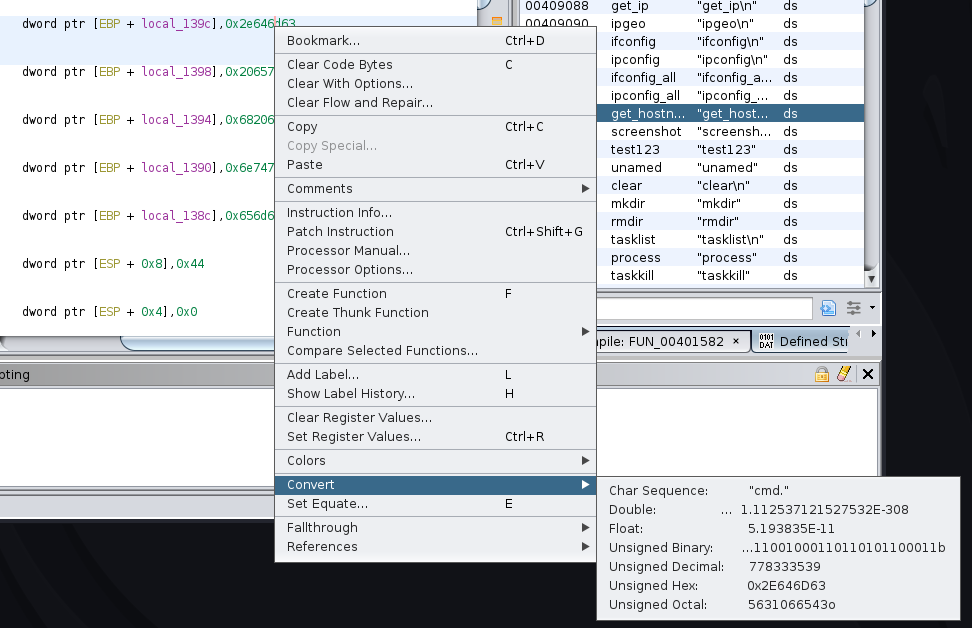
Choose Convert from that menu, which leads to a sub-menu reporting all possible variations. You can choose any of
the variations, and the value displayed will change to match. Perform this operation for each of the EBP-referencing
MOV lines, and you’ll get:
004036e3 c7 85 6c        MOV        dword ptr [EBP + local_139c],"cmd."
         ec ff ff
         63 6d 64 2e
004036ed c7 85 70        MOV        dword ptr [EBP + local_1398],"exe "
         ec ff ff
         65 78 65 20
004036f7 c7 85 74        MOV        dword ptr [EBP + local_1394],"/c h"
         ec ff ff
         2f 63 20 68
00403701 c7 85 78        MOV        dword ptr [EBP + local_1390],"ostn"
         ec ff ff
         6f 73 74 6e
0040370b c7 85 7c        MOV        dword ptr [EBP + local_138c],"ame\x00"
         ec ff ff
         61 6d 65 00
That is much easier to work with, and allows you to quickly identify that the code is building the following string 4 bytes at a time:
cmd.exe /c hostname
Finally, if we look back at the source at
https://github.com/Unam3dd/RevolutionShellV0.1/blob/master/revolution_backdoor_windows.cpp
, we can see that the
code at line #452
implements this code. Scrolling back up, we can determine that the really long function this lives within is the
main function. As I’ve been walking around this function, the Decompiler view has been tracking my work and
reports this function is FUN_00401582. So, I can use the Symbol Tree viewer, just as we did earlier, to find this
function and name it main.
Often it is the case that you want to track down the main function first, and then it can become easier to determine
names for all of the other functions once you are able to view them in the context in which they’re used by calling
functions.